IPv4 Address Report
This report generated at 02-Dec-2025 07:58 UTC.
| IANA Unallocated Address Pool Exhaustion: | |||
| 03-Feb-2011 | |||
| | |||
| Projected RIR Address Pool Exhaustion Dates: | |||
| RIR | Projected Exhaustion Date | Remaining Addresses in RIR Pool (/8s) | |
| APNIC: | 19-Apr-2011 (actual) | 0.1877 | |
| RIPE NCC: | 14-Sep-2012 (actual) | 0.0001 | |
| LACNIC: | 10-Jun-2014 (actual) | ||
| ARIN: | 24 Sep-2015 (actual) | 0.0119 | |
| AFRINIC: | 31-Dec--1 | 0.0471 | |

Projection of consumption of Remaining RIR Address Pools
Current Status
The IPv4 address space is a 32 bit field. There are 4,294,967,296 unique values, considered in this context as a sequence of 256 "/8s", where each "/8" corresponds to 16,777,216 unique address values.
As noted in RFC 5735 a number of address blocks are 'reserved.' There are a total of the equivalent of 35.078 /8 address blocks that are 'reserved'. (This is composed of 16 /8 blocks reserved for use in multicast scenarios, 16 /8 blocks reserved for some unspecified future use, a /8 (0.0.0.0/8) for local identification, a /8 for loopback (127.0.0.0/8), and a /8 reserved for private use (10.0.0.0/8). Smaller address blocks are also reserved for other special uses.)
The remaining 220.922 /8 address blocks are available for use in the public IPv4 Internet. The current status of the total IPv4 address space is indicated in Figure 1.
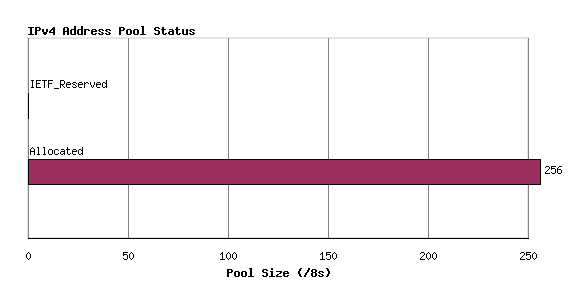
Figure 1 - Address Pool Status
This allocated number pool is managed by the Regional Internet Registries, (RIRs) and the breakdown of IANA allocated address blocks to each of the RIRs is shown in Figure 2.
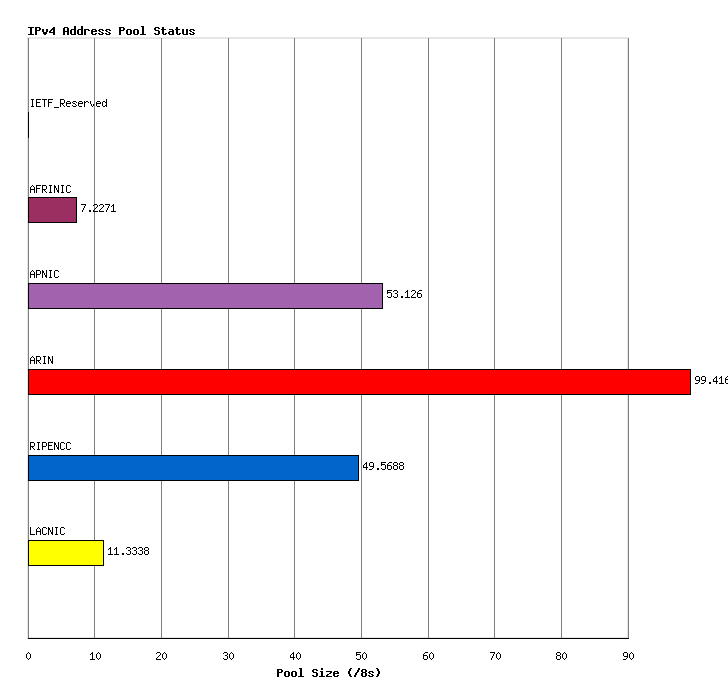
Figure 2 - Address allocations to RIRs
Any individual IPv4 address can be in any one of five states:
- reserved for special use, or
- part of the IANA unallocated address pool,
- part of the unassigned pool held by an RIR,
- assigned to an end user entity but not advertised in the routing system, or
- assigned and advertised in BGP.
The current totals of IP addresses according to this set of states is shown in Figure 3.
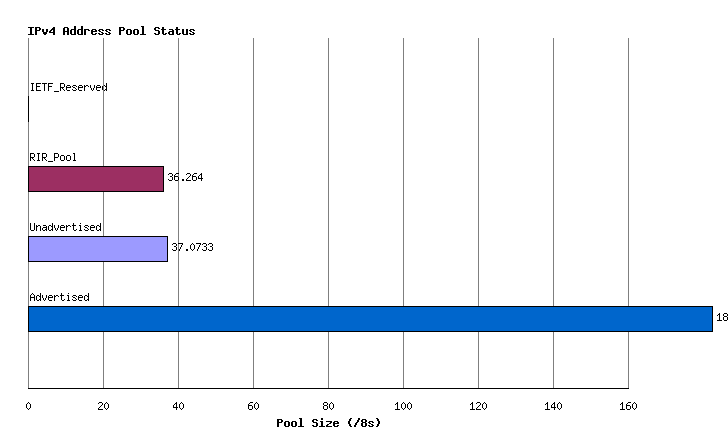
Figure 3 - Address Pools by State
This status can be further categorized per RIR, as shown in Figure 4.

Figure 4 - Address Pools by RIR by State
Another view of the address state pools is by grouping the address space into a sequence of /8s, and looking at state sub totals within each /8 address block. The following view shows the current status of the IPv4 address space as 256 /8 columns each describing a pool of 16,777,216 addresses.
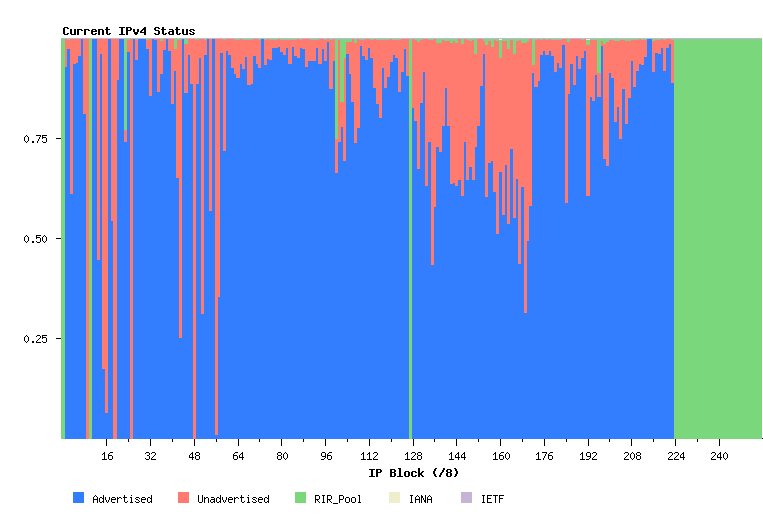
Figure 5 - IPv4 Address Status
Time Series Data
Allocations
IPv4 Address are drawn from the Unallocated Address Number Pool, administered by the IANA. These allocations are made to the Regional Internet Registries (RIRs), and the allocation unit is in units of /8s.
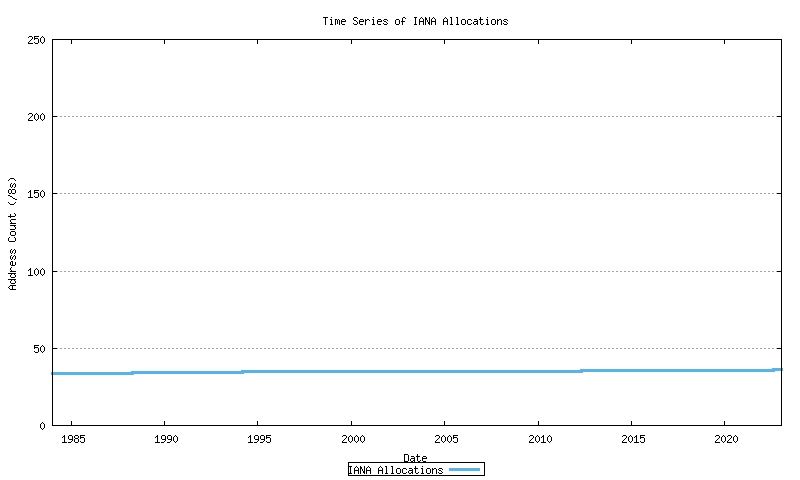
Figure 6 - Cumulative IANA Address allocations
This series can be further broken down by RIR.
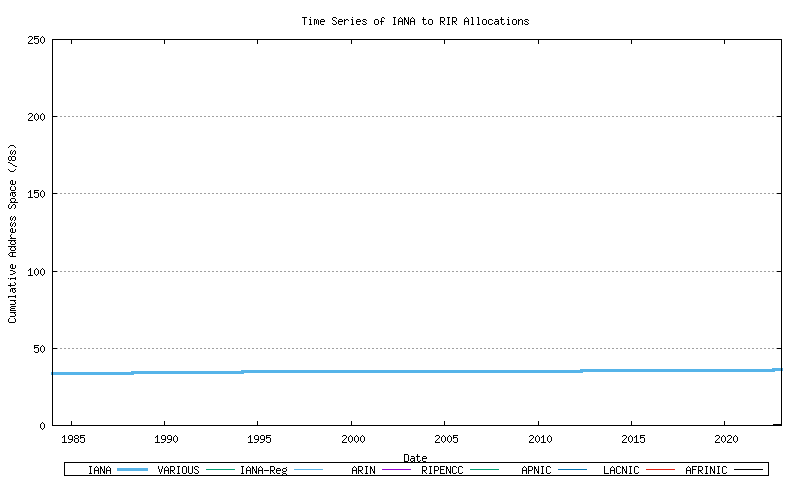
Figure 7 - Cumulative IANA Address block allocations per RIR
Assignments
RIRs perform assignments of address blocks to ISPs and local Internet registries. The cumulative number of assigned addresses over time is shown in Figure 8.
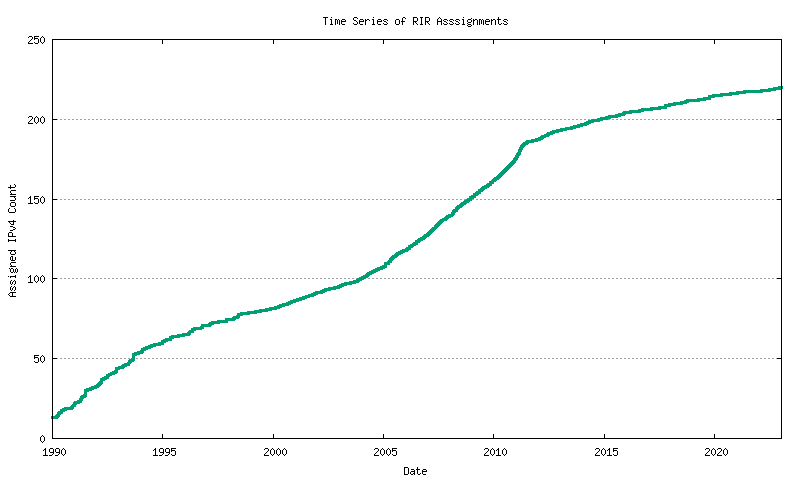
Figure 8 - Cumulative RIR Address assignments
This data can be further categorized by RIR.
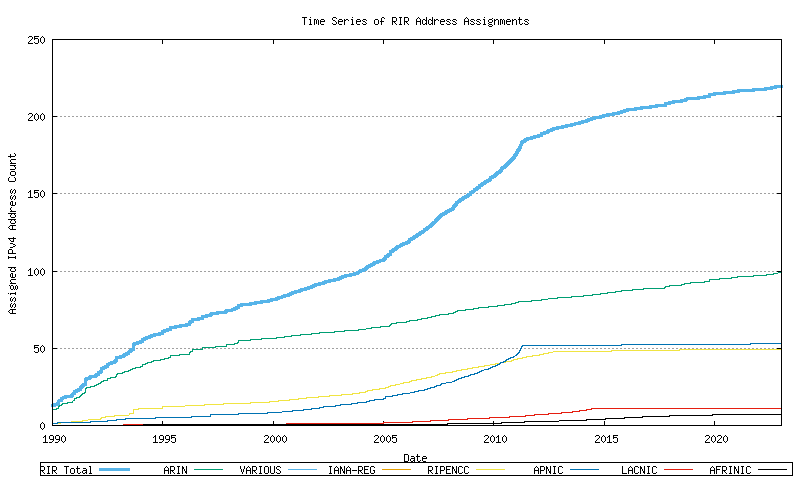
Figure 9 - Cumulative RIR address assignments, per RIR
RIR Pools
Each RIR allocates from its locally administered number pool. When the pool reaches a low threshold size a further address block is allocated by IANA to the RIR. The allocation quantity is based on the allocation activity recorded by the RIR for the 18 months prior to the allocation request, rounded to the next largest /8 address block. The pool size within each RIR over time can be derived from the allocation and assignment series data, producing the following graph. This is indicated in Figure 10.
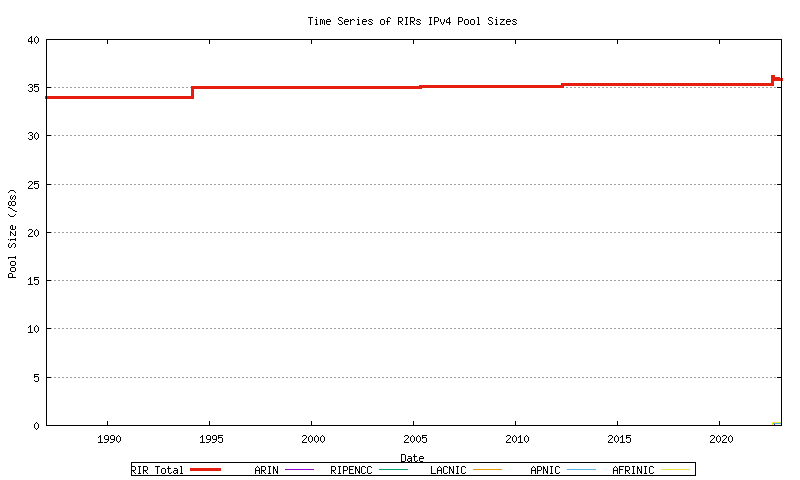
Figure 10 - RIR Address Pool size
The more recent data from this series is shown in Figure 10a.
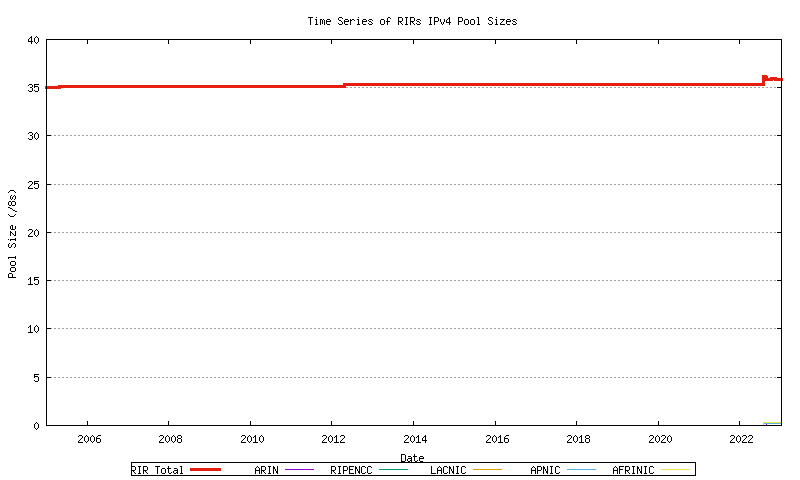
Figure 10a - RIR Address Pool size
Advertisements
The next data set is total span of address space advertised in the BGP routing table over time. The data has been collected since late 1999. This is shown in Figure 11.

Figure 11 - Advertised Address Count
u
Models for Address Consumption
Models for Data Series
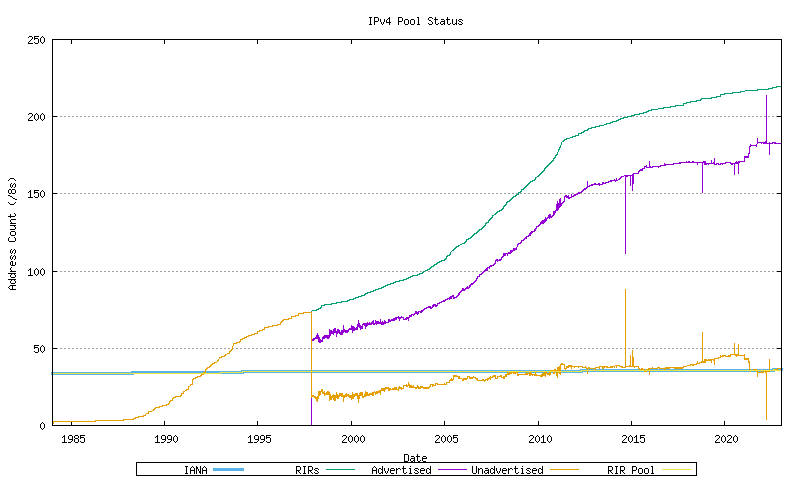
The foloowing figure constructs a relatively complete view of the sequences of various address pools over time. Figure 16 shows the total amount of space allocated by the IANA to the RIRs, the total amount of space that has been allocated by the RIRs, the total amount of space advertised in the routing table, the total amount of unadvertised space that has been allocated, and the total amount of address space that is held in the RIR's local allocation pools. This is indicated in Figure 16. The objective here is to generate a predictive model that can be used to extend these series forward in time in order to estimate a point of exhaustion of the unallocated address pool
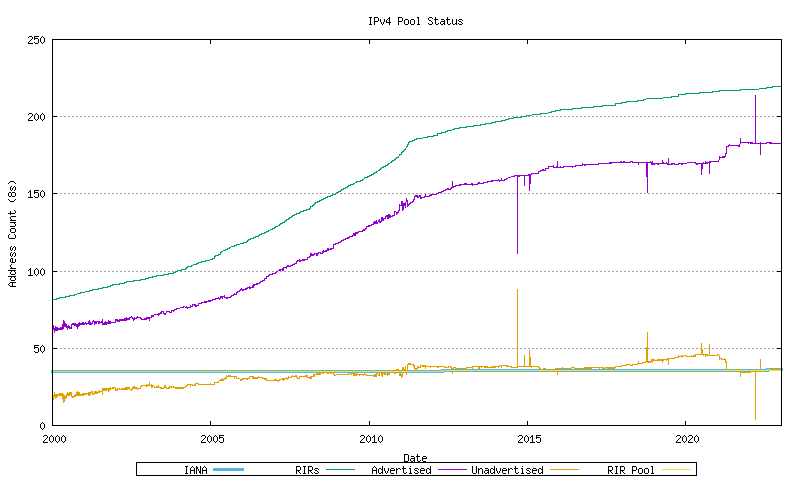
Figure 16 - IPv4 Address Pool StatusThe more recent section of these series is indicated in Figure 17. The approach used here is to take a recent sequence of data as the baseline for a predictive model.
Figure 17 - IPv4 Address Pool Status - since 2000
IANA Data Series
Before looking in detail at the advertised address space, the IANA allocation data and RIR allocation data will be examined, and a relatively straightforward form of data analysis will be performed over the data series.
The IANA allocation data is indicated in Figure 18.
Figure 18 - IANA Allocation SeriesRIR Allocations
The RIR allocation data is indicated in Figure 19. This data is shown in both its original format, and in a smoothed format, using a sliding window smoothing algorithm, in a double pass of the smoothing algorithm across the data.
Figure 19 - RIR Allocation SeriesBGP Advertised Address Range
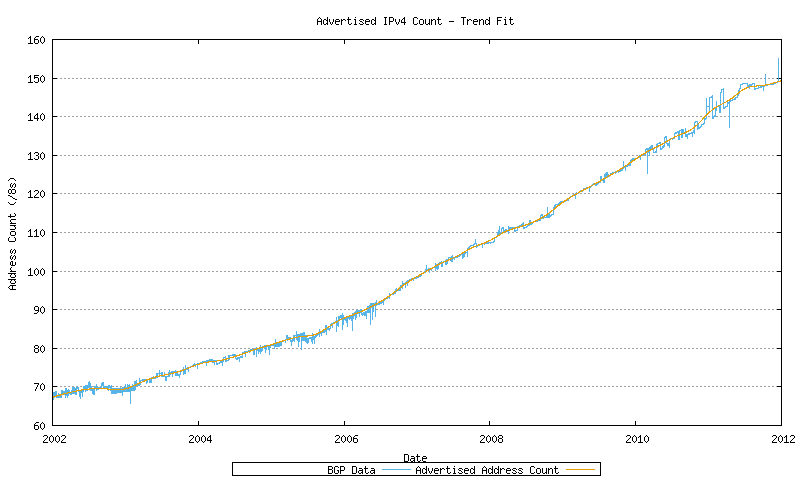
The BGP advertised address span data is indicated in Figure 20.
Figure 20 - BGP Advertised Series
Predicting Address Pool Exhaustion
Modelling RIR Allocations
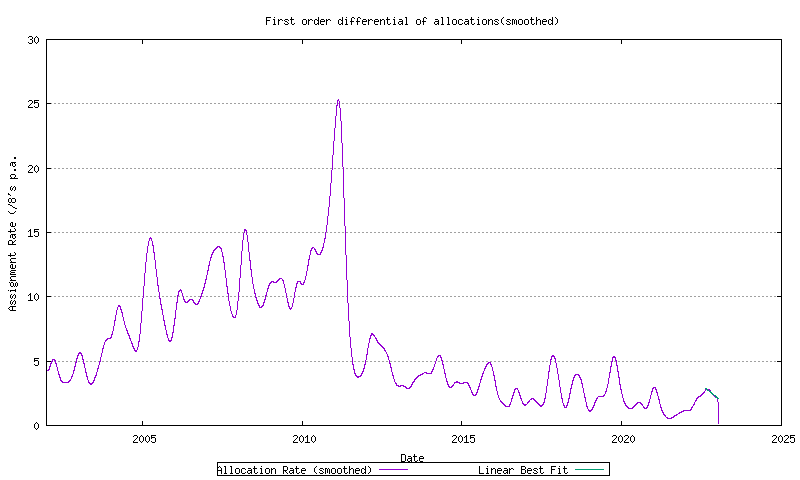
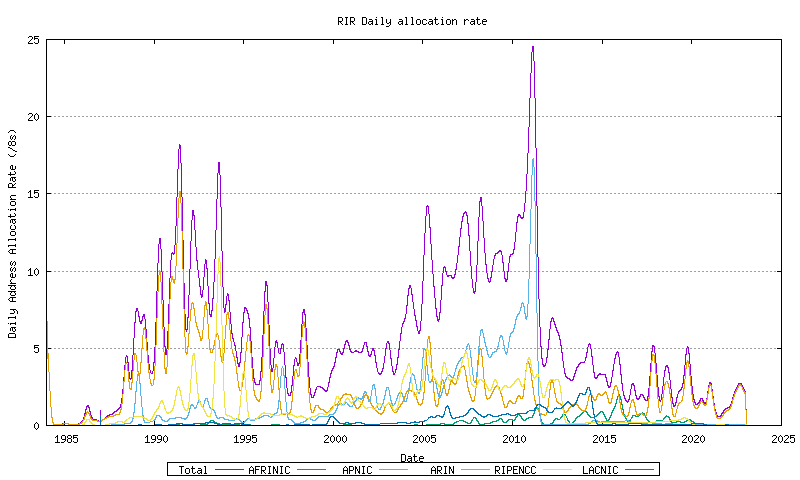
The approach used here to modelling overall address consumption levels is to use the RIR allocation information as the baseline of the address consumption model. This approach treats an address as "consumed" once it has been allocated or assigned by an RIR. The data used to construct the time series of allocations is the allocation "stats file" published on a daily basis by each RIR, placed into a time series, as indicated in Figure 9. The first order differential of the smoothed total allocation rate can be generated, as shown in Figure 27. A least squares linear best fit can be generated for the recent part of this data.
Figure 27 - Rate of RIR Allocations - First order differential of allocation data seriesThe allocation rates for each RIR are shown in the following figures.
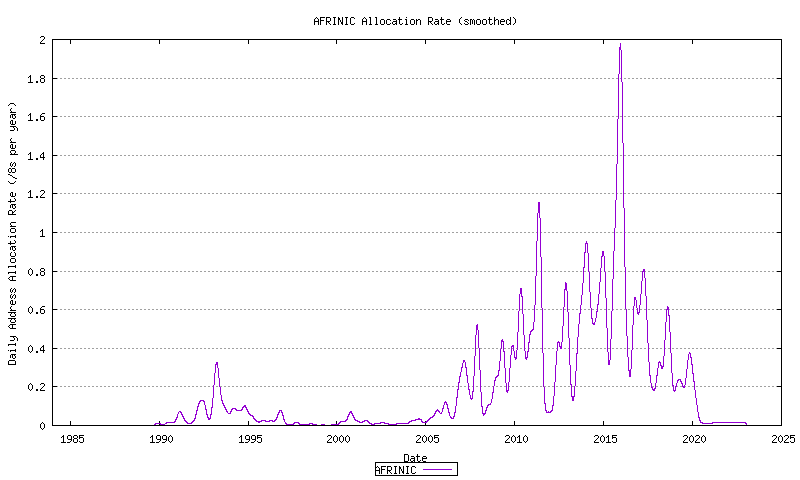
Figure 28a - AFRINIC Address Allocation Rate
Figure 28b - APNIC Address Allocation Rate
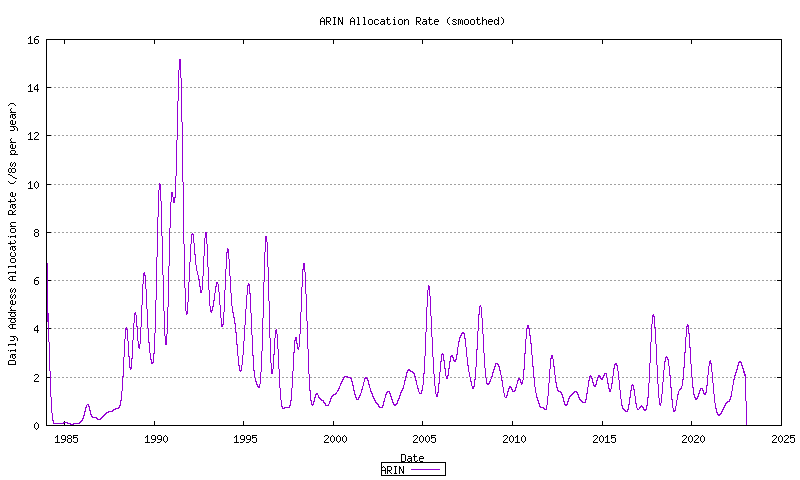
Figure 28c - ARIN Address Allocation Rate
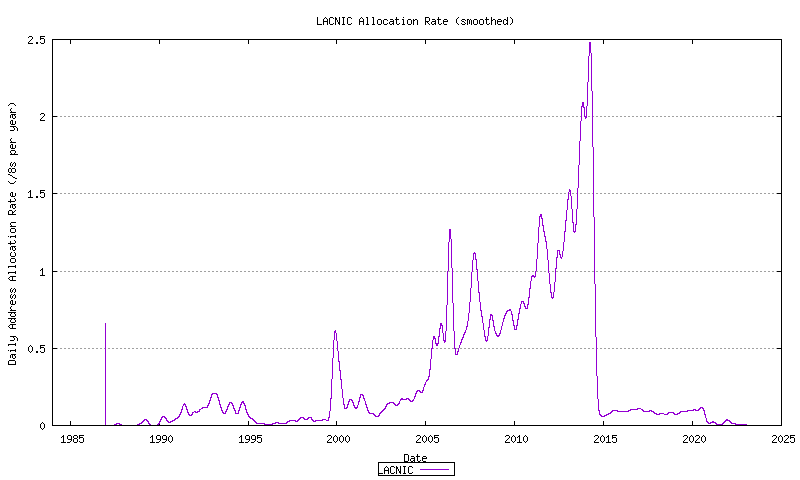
Figure 28d - LACNIC Address Allocation Rate
Figure 28e - RIPE NCC Address Allocation Rate
Figure 28f - Combined Address Allocation Rate
Geoff Huston